There are plenty of articles and presentations describing mature Continuous Delivery systems but few that discuss the early evolution of a deployment process. It’s a long road from startup infancy to enterprise adulthood and there are many forms a deployment process will take along the way.
Over the past year and a half our engineering team has tripled and the data we process for our customers has increased exponentially. We’ve spent much of that time thinking about how to continue to ship quality code quickly.
The Front End team is one of three engineering teams at Localytics. Here is how we looked in the Fall of 2012:
- Three engineers doing full stack web development using Rails, CoffeeScript, AngularJS, D3.js, MySQL, Sidekiq, etc.
- A single production Rails server hosted on AWS
- Jenkins configured to run tests on changes to master
Shipping code began by developing locally, writing unit tests (usually), and then opening a Pull Request on GitHub. Once the PR was reviewed and merged to master, running cap deploy (a capistrano command)on the console would deploy master to production. Someone might check Jenkins at some point but Continuous Integration was not formally part of the deploy process.
This setup may seem familiar and can work well for small teams but issues crop up as the team grows and the speed of development increases. Here, I highlight three key enhancements to our deployment process that have helped us grow from startup infancy to, say, engineering adolescence: blue green deployment, comprehensive testing, and broader automation.
Phase One: Blue Green Deployment
Deploying to a production server using Capistrano is risky. Sometimes deploys fail and the differences between Production and Development environments are difficult to anticipate and test. We eliminated this risk by instituting a Blue Green Deployment system. We configured a load balancer with two clusters of two Rails servers each. At any given time, one of these clusters would be the "hot" cluster, used by our customers via dashboard.localytics.com. The other cluster would be the "cold" cluster, accessed by an internally available URL. Both environments were connected to the same production databases so the only difference was the URL to accessed them and the version of the code they were running.
We updated our deploy process to include two Capistrano tasks instead of one:
cap cold deploy- Deploy master to the “cold” cluster. New code is now available internally. Engineers and Product Managers can take a last look before changes are live.cap switch_to_cold- Switch production traffic to the cluster with the newly deployed code.
Let’s dive into the implementation. For technical reasons I won’t get into here we decided not to use Amazons’ ELB service. Instead we rolled our own load balancer which includes nginx for SSL termination chained with HAProxy for load balancing and URL-based routing. We used EC2 Tags to determine which Rails servers were hot and which were cold. Given these details lets take another look at our two Capistrano tasks.
cap cold deploy looks up which servers are cold by querying AWS for EC2 instances where tag group = “cold”, then deploys master to those EC2 instances.
cap switch_to_cold gets a list of both hot and cold servers from AWS. We also want to update HAProxy which means pointing dashboard.localytics.com traffic to cold servers, and pointing cold server traffic to hot servers. Last, we update EC2 tags. Cold servers are now hot and hot servers are now cold.
Implementing our hot and cold (or Blue Green Deployment) system has been an important change that allows us to make a final sanity check before exposing our customers to new code. Also if, shortly after a deploy, Airbrake or New Relic alerts us to a problem with production, we can quickly rollback by switching traffic back to the previously hot servers.
Phase Two: Incorporate Testing into the Deployment Process
Not only was Continuous Integration missing from our deployment process, but our code coverage was a dismal 23%. As a first step we wired up Poltergeist and built out integration tests using Capybara. Next, we configured Jenkins to execute tests on every push to GitHub rather than when we merged to master. We were now notified of test failures as we were developing rather than just before we were ready to deploy. As a team we committed to writing more tests and our code coverage began to climb.
A new challenge created by our increased code coverage was the execution time of our test suites. We updated code to speed up tests by tweaking garbage collection and optimizing our factories. We also explored hardware upgrades such as faster CPU, more memory and SSDs. We realized it was a good time to pay someone else to worry about many of these details, so we migrated our test suite to CodeShip. CodeShip makes it easy to execute tests in parallel, it has a slick UI and integrations with many third parties such as Coveralls which we now to use for tracking our code coverage. CodeShip also integrates well with Github so if a test run fails, the Pull Request gets flagged by CodeShip. This prevents the author of the PR from merging to master which prevents broken code from making it to production. Continuous Integration was now officially baked into our deployment pipeline!
We had made dramatic improvements to our process but we knew it would be a while until our code coverage approached our goal of 80%. We considered quick wins that could provide us more confidence when making changes to production and came up with Live Tests.
Live Tests
There are a several aspects of our production environment that are difficult to replicate in isolated tests. Signing up for a new Localytics account begins on our marketing site and flows onto our Rails app. Data used by our sales team to demo our product is found only on our production analytics database. Eventually we will build mocks, fixtures and staging environments to fully test what is now unique to production but in the meantime we found a high ROI by creating Live Tests that run directly on our production environment. We wired these into the Capistrano task that deploys to our cold servers. Revisiting our deploy process from above, deploying to cold now includes running Live Tests:
cap cold deploy
- Pull the list of cold servers
- Deploy master to those servers
- Run live tests on the cold servers
Live Tests now serve as a final gate to switching production traffic to cold servers. We don’t want to make these tests too heavy. If they are slow or if they reveal bugs, the deployment pipeline can become blocked. It’s better to test as much as possible before code gets on cold so while we enjoyed these quick wins brought to us by Live Tests, we are continuing to focus on increasing our code coverage within our Continuous Integration test suites.
Phase Three: Automation
Eighteen months ago, our systems were simpler and our team was smaller. Making changes to production was not a big deal because it was easy for us to keep everything in our heads and avoid mistakes. But as the complexity of our system grew, the knowledge required to update production grew and as we added engineers, the number of people required to know that information increased. To mitigate this exponentially increasing overhead, we reduced the required knowledge by automating common processes. Having solid automated systems abstracts away the underlying details and reduces the opportunity for human error. It allows us to reduce the mindshare dedicated to repeated tedious tasks which allows us to spend more time focused on the product.
Stager
The first major automation project was Stager. Before Stager, we had a limited number of provisioned staging environments available for Front End engineers to demo and test features. If someone wanted to stage a feature, they would first track down an unused server, then configure the server to point to the correct database, then find the correct Capistrano task for that environment, and finally deploy the changes. But it soon became difficult to keep track of which environment had what features. Product Managers wanted to preview new features so engineers would deploy them to a staging environment, and by the time the PM went to see the feature, the environment had been taken by another engineer. Enter Stager.
Stager listens for Pull Requests and automatically creates staging environments for each feature branch. Create a PR and, two minutes later, your changes are live on a fully operational environment. It even adds a comment on the PR with a link to the environment:
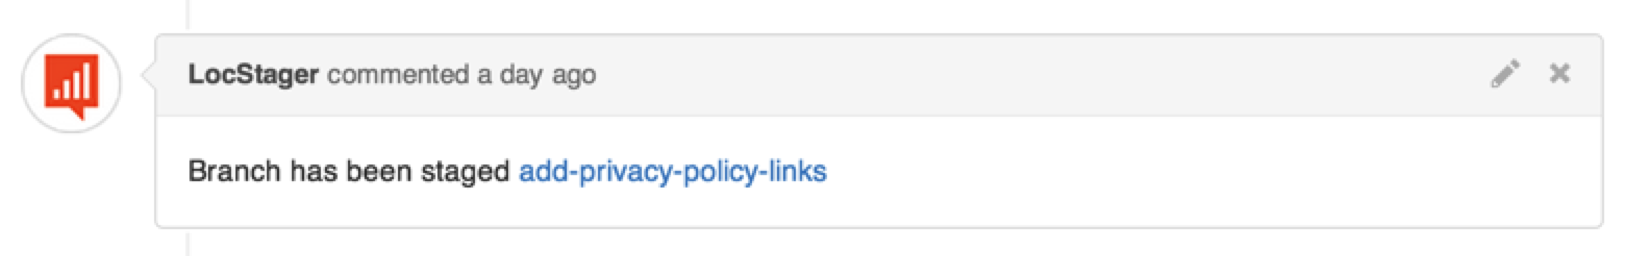
Close the Pull Request and Stager spins down the environment and removes the comment from GitHub. Front End engineers don’t need to worry about staging environments, Product Managers don’t need to ask where features are staged, and our deploy.rb is much simpler. It just works and was only a couple days before we couldn’t imagine living without it.
Stager is based on nginx, Sinatra and Docker. It will soon be open-sourced and is the topic of an upcoming blog post.
Deployer
At this point in our growth, deploying code to production involved running two Capistrano tasks and optionally running migrations on our production database via Rake. The more engineers who could deploy code, the more difficult it became to keep track of who was deploying what. We built Deployer to get this process out of our consoles and into a centralized web application in order to make it easier to:
- Ensure that only one person is deploying at a time.
- Provide visibility to the current state of our deployment pipeline.
- Manage access to who can deploy.
- Prevent mistakes when running migrations.
- Add integrations with other systems.
- Provide a way to rollback to previous versions.
No doubt, many companies have built similar systems for their own deployment needs. There were several requirements specific to our needs which made using open source options, like Deployinator, not a good fit for us. The first step to building Deployer was to provide a wrapper around the Rake tasks we were already using and we were able to save time by leveraging ideas and code from the simple but well-thought out Strano project. We then built out more features around our workflow, added authentication to Github and launched Deployer. We said goodbye to the days of deploying from our console and eliminated contention caused by multiple engineers deploying at the same time.
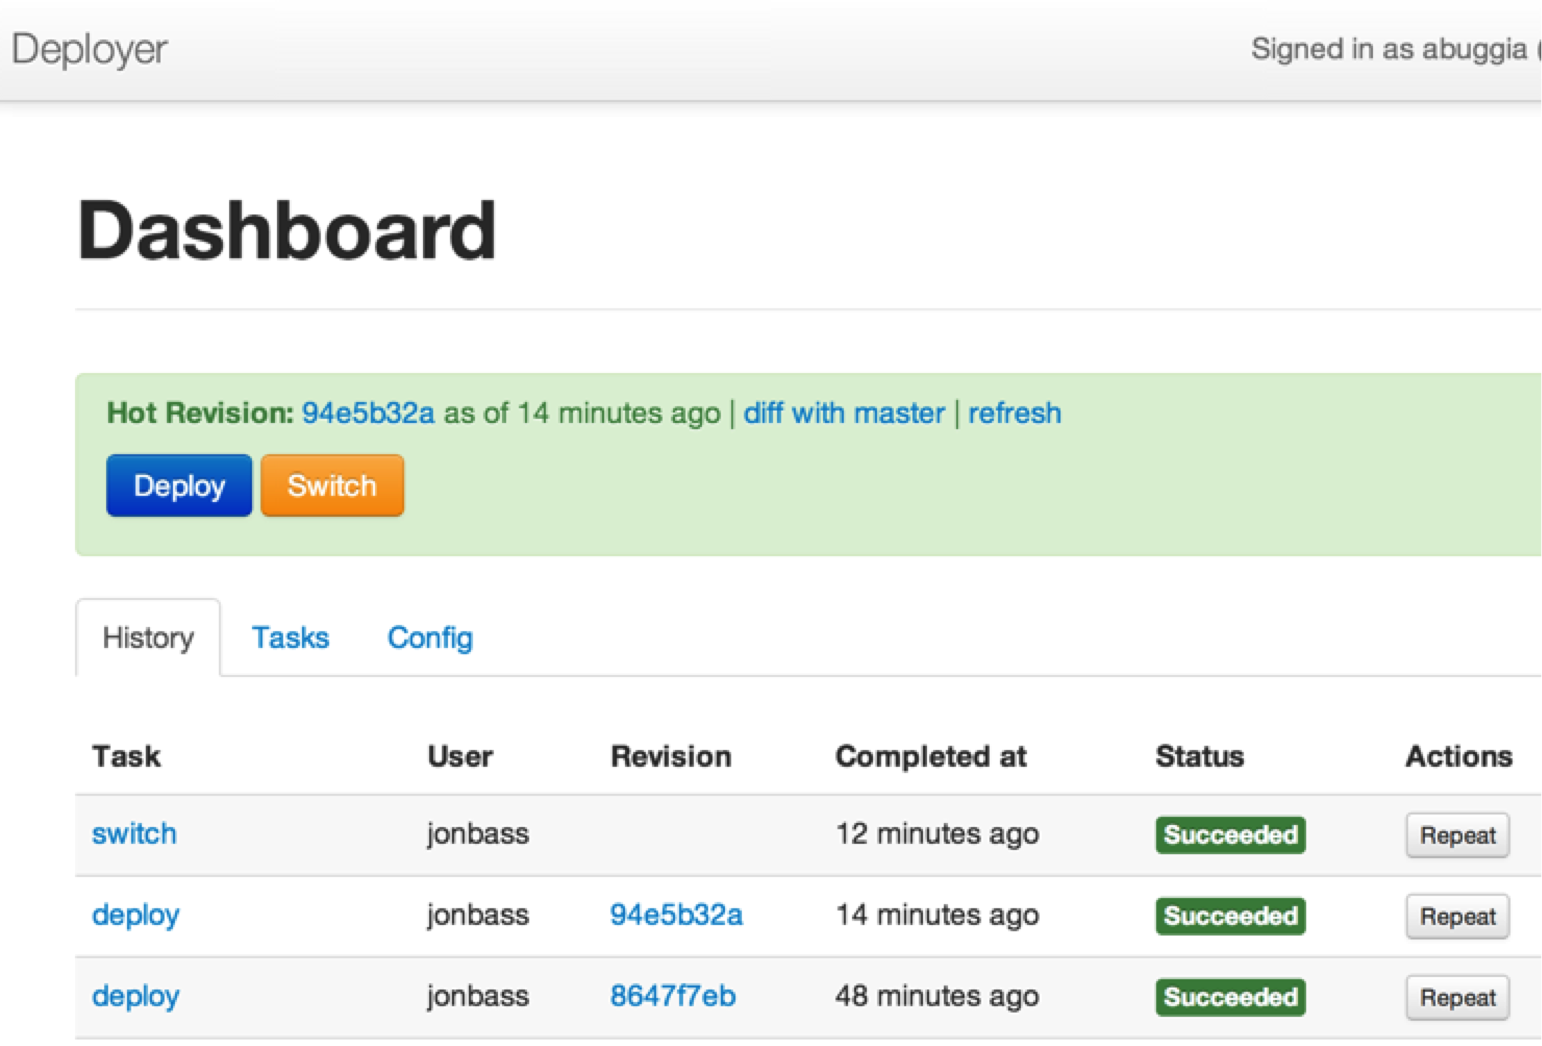
We’re now able to deploy code with the click of a button using the same Capistrano tasks under the hood. We have visibility to who is deploying what and we’re able to rollback to any previous version with a single click.
Chatops
Taking inspiration from GitHub's implementation, we integrated both Deployer and Stager into our chat windows. We’ve been using Slack for the past few months and have enjoyed the slick UI and powerful features.
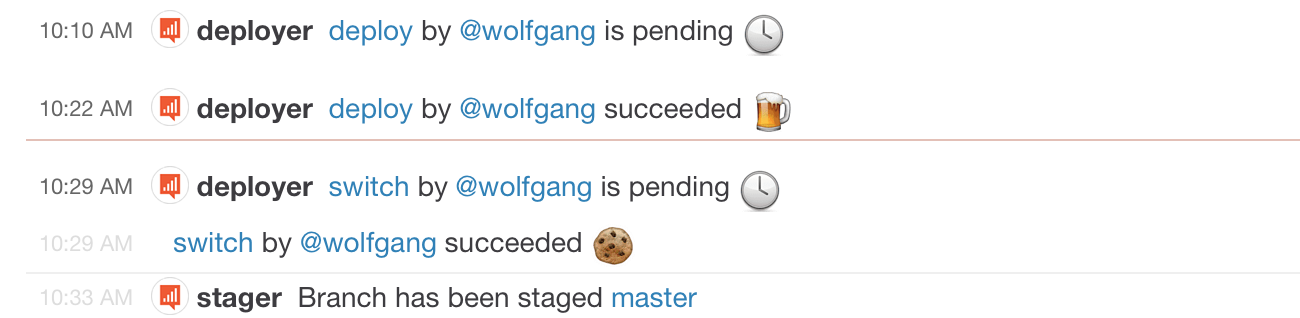
From within a Slack channel, Front End engineers can easily:
- Deploy to production.
- Stage a branch to an internally accessible URL.
- View a diff between the code on production and the code on cold.
- Run Live Tests against production.
- View alerts from New Relic and Airbrake
Logging the conversation between our engineers and our production systems in one Slack channel allows everyone to keep up to date with the current state of production and enables new team members to quickly learn how to deploy code on their own.
Conclusion
When the Front End team was only three engineers we were each expected to bring features from design to production which meant we were solely responsible for the quality of each feature. As our team grew we invested in our infrastructure so high quality could remain a reasonable expectation for each of us, even as the system became more complex and engineers became more specialized. This has allowed us to maintain agility and limit the inevitable decrease in incremental productivity for each new hire. Our engineers are the most productive and motivated when it is easy to ship and hard to make mistakes.
None of the ideas here are new concepts. We have plenty of work ahead before we have a robust Continuous Delivery system but we’ve done our best to balance our time between building our product and investing in our infrastructure to keep the maturity of our delivery process commensurate with the size of our team.
Epilogue
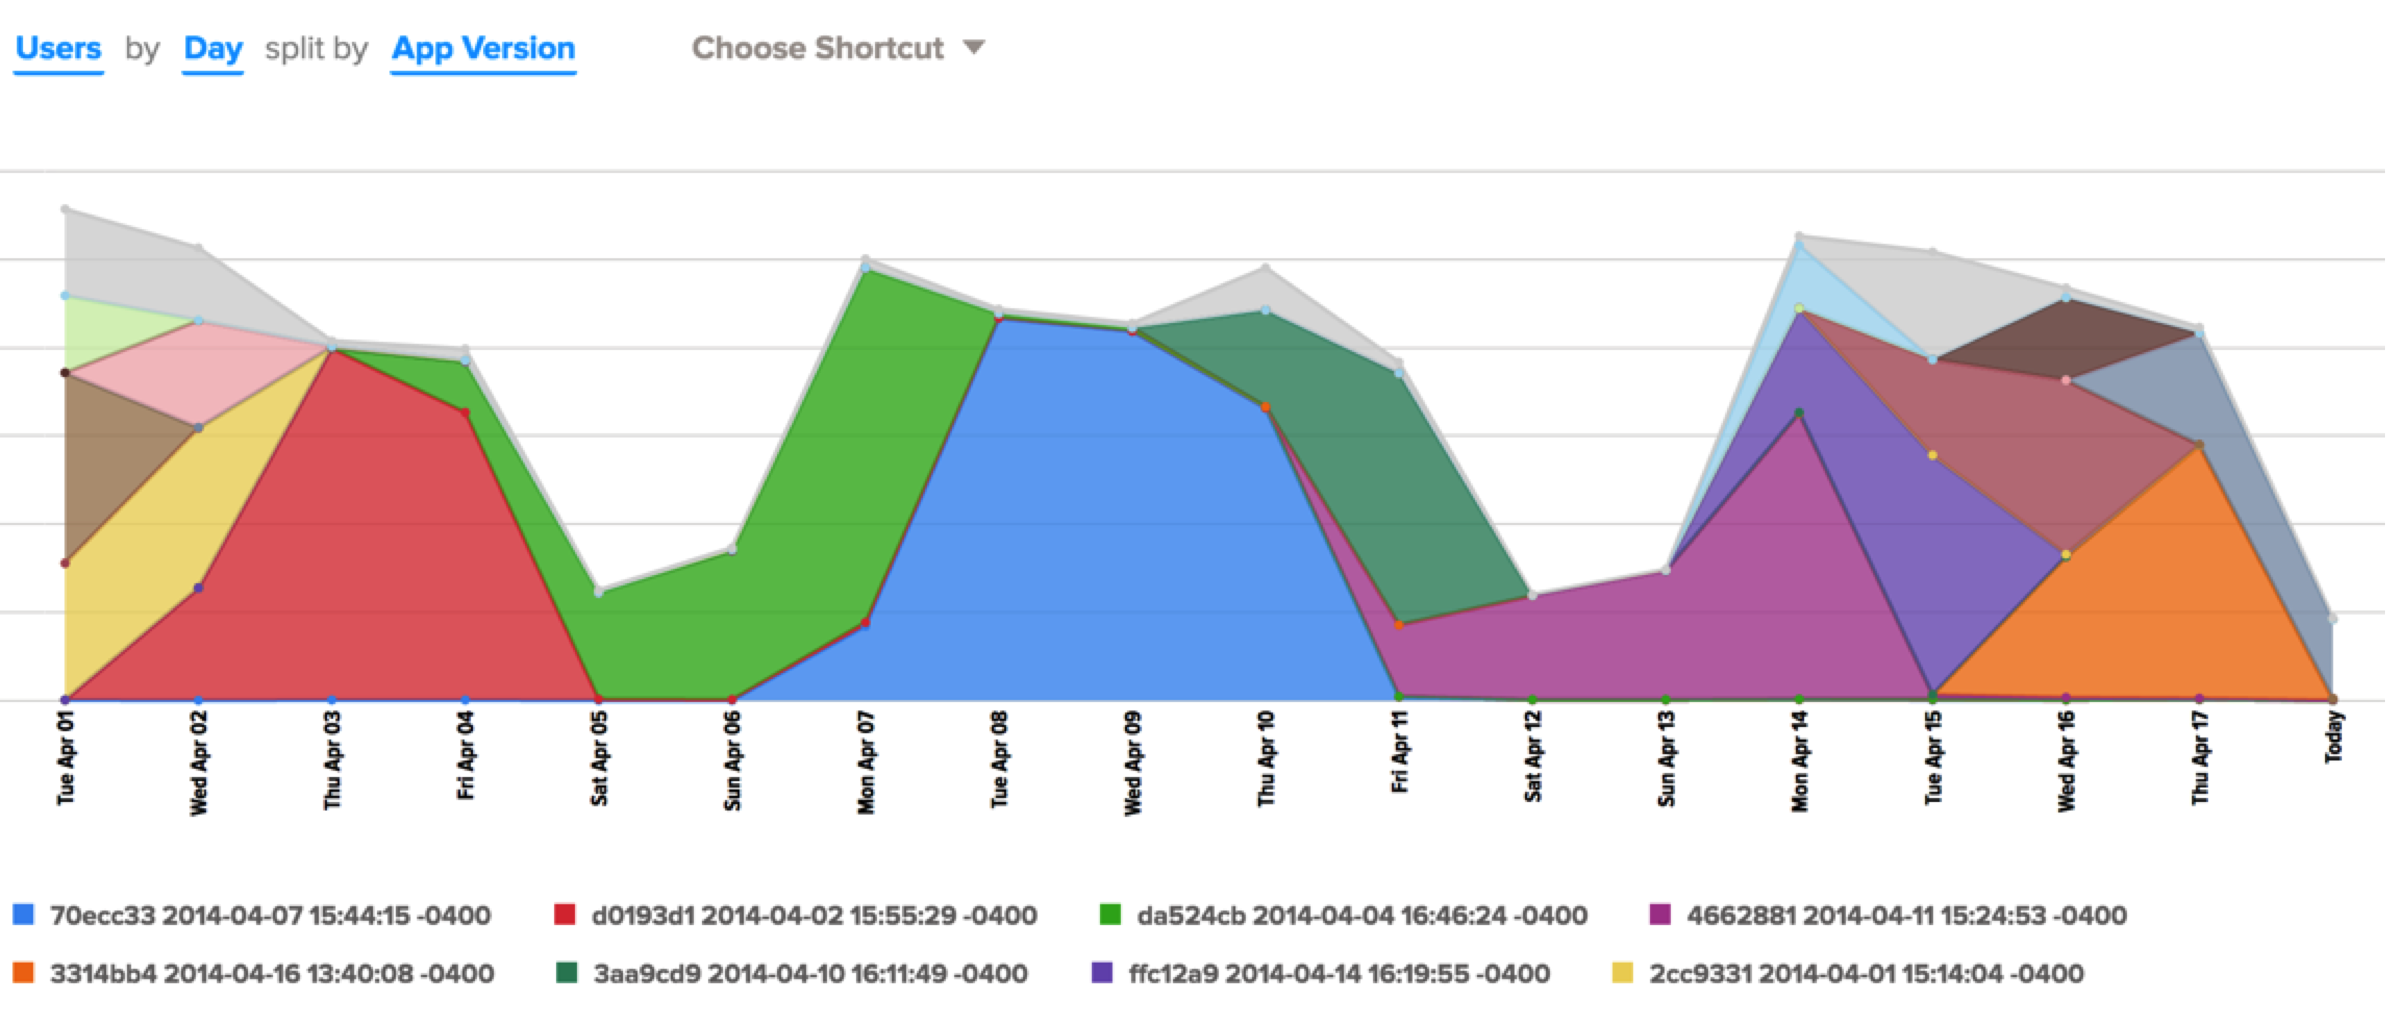
Today we deploy to our web application several times a day. The Localytics Dashboard is one of many internal systems where we dogfood our analytics. The chart below shows a couple weeks in April where we were deploying to the Dashboard three to seven times a day. The App Version dimension below is represented by the Git commit hash of the code that was live at the time.
Thank you to Jon Bass, Sandeep Ghael and Tristan Harward for contributing to this article. Thank you to @atmos for advice on our first steps into Chatops.